Overview
This interface uses ANTARES public data from https://antares.in2p3.fr/publicdata2017.html. This data contain the directions of arrival of events detected by the ANTARES neu- trino telescope and used for point source searches from 2007 to 2017 [see G.Illuminati, PoS(ICRC2019)920].
The data declination distribution is extracted from the dataset and its cumulative distribution is fitted with a sixth-degree polynomial in order to have a declination dependent estimation of the background from a specific direction and for a defined region of interest around that direction. The usage of this polynomial function avoids re-reading each time the data file to extract the number of background events coming from that region. A schematic representation of this background estimation production is given in the figure below
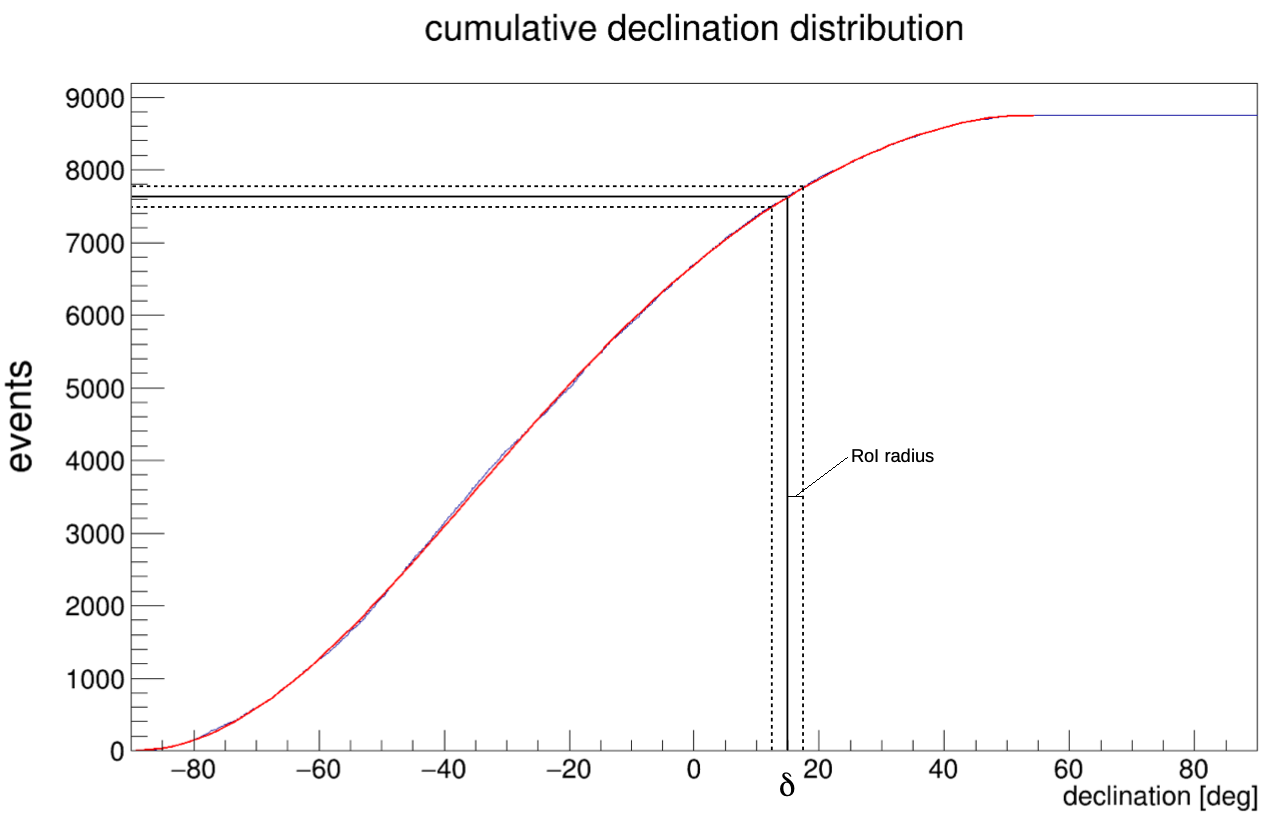
Given a user-defined declination δ and a user-defined radius of the region of interest (RoI) for the source, the values of the polynomial for δ − RoI and δ + RoI are estimated, and the difference between these two value is taken as the number of background events from the declination band containing δ. This number is scaled by the solid angle encompassed by the band to obtain a number of events per sr, and then scaled to the RoI size in sr so that the expected number of events from background in the RoI is obtained.
The number of background events estimated with this computation is compared to the number of events that are found in the RoI in the real data using Feldman-Cousins statistics to obtain upper limit (and also if it is the case a lower limit) at 90% confidence level in terms of ”signal” events. This number of signal events is transformed to limits in terms of neutrino flux using the acceptance of ANTARES. The Acceptance is defined as: F1f*Acceptance1f=ns, for a single flavour (1f) analysis, where F1f is the single flavour signal flux producing ns events in the sample.
The acceptance is obtained for different spectral indexes, ranging from 1.5 to 3.0 in steps of 0.1 assuming an unbroken power-law spectrum. Acceptances are computed from the ANTARES official Monte Carlo set and are reported in units of 10−8 GeV1−γ cm2 s in a lookup table.
To extract upper limit on the flux of specific source, enter the source name in the top "general" parameter panel and click on "resolve" button to find the source coordinates using one of the commonly used astronomical name resolvers. Otherwise, it is posssible to directly enter the coordinates in the "RA" and "DEC" fields. If both source name and coordinates are given, the results will be extracted for the direciton given by the coordinates.
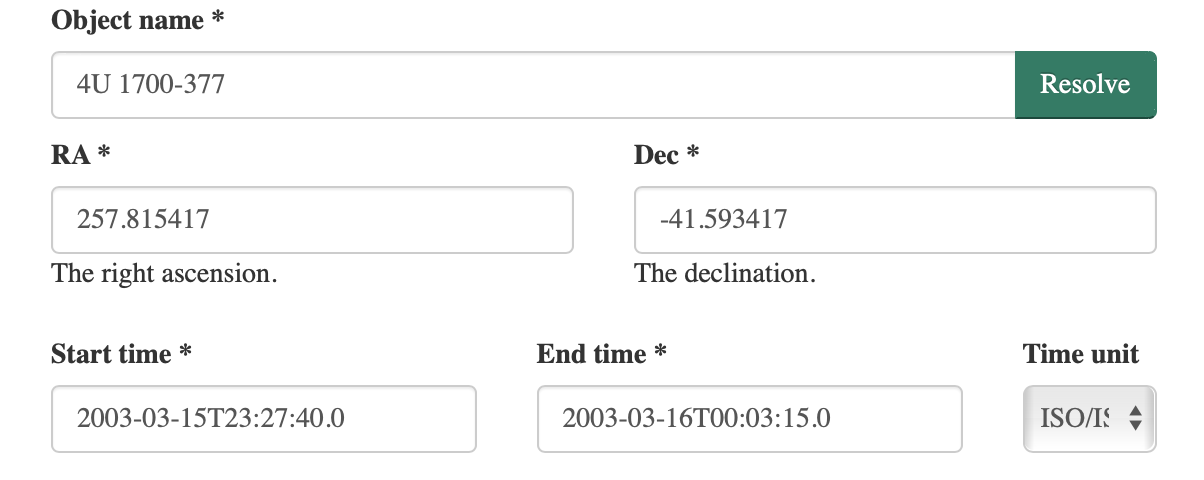
N.B. The general parameter panel provides a possibility to spcify time interval for the analysis. The time information is currently not used. Only time-integrated upper limits for the full time 2007-2017 time span are calculated.
Once the sky coordinates are chosen, there is one more parameter to specify in the "ANTARES" specific parameter field: the size of the RoI. This radius should in principle be close to the point spread function of ANTARES. The "optimimal" RoI radius is however not known in advance, it can be different for different sky directions, depending on the level of background. The current version of the online analysis interface does not take in to account the full point spread function model of ANTARES telescope and the resulting upper limits on the source flux depend on the choice of the RoI radius. This explains slight discrepancy of the resullting upper limits on fluxes of specific sources and the limits published in G.Illuminati, PoS(ICRC2019)920. Next version of the online analysis will include the account of the point spread function.
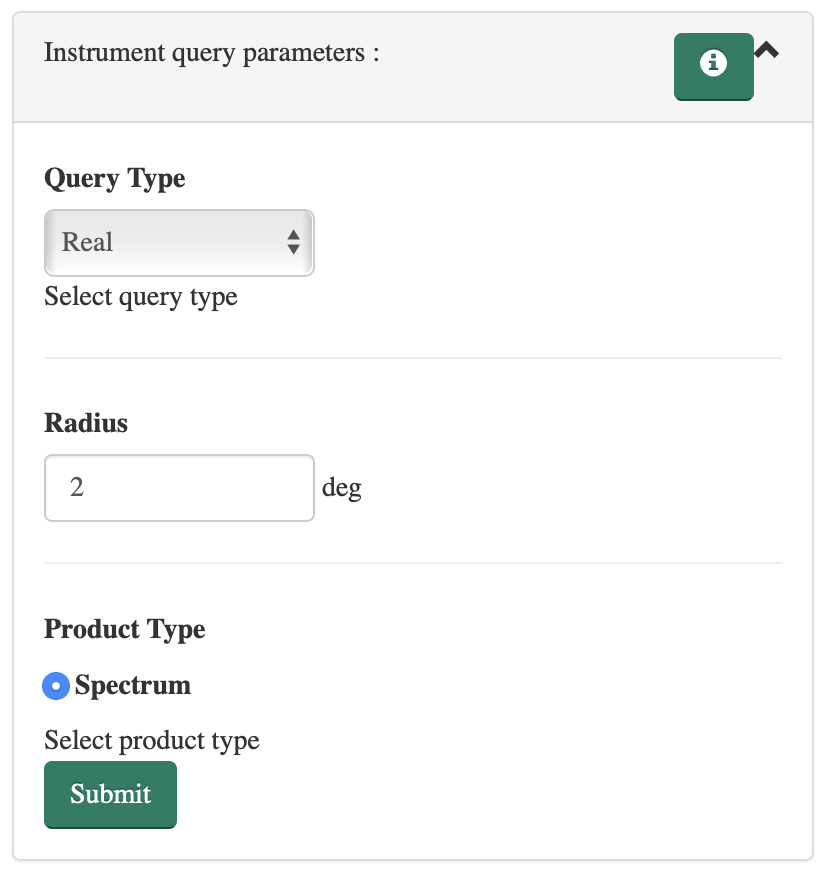
To launch the analysis, press "Submit" button. The result will be shown in the form of a plot:
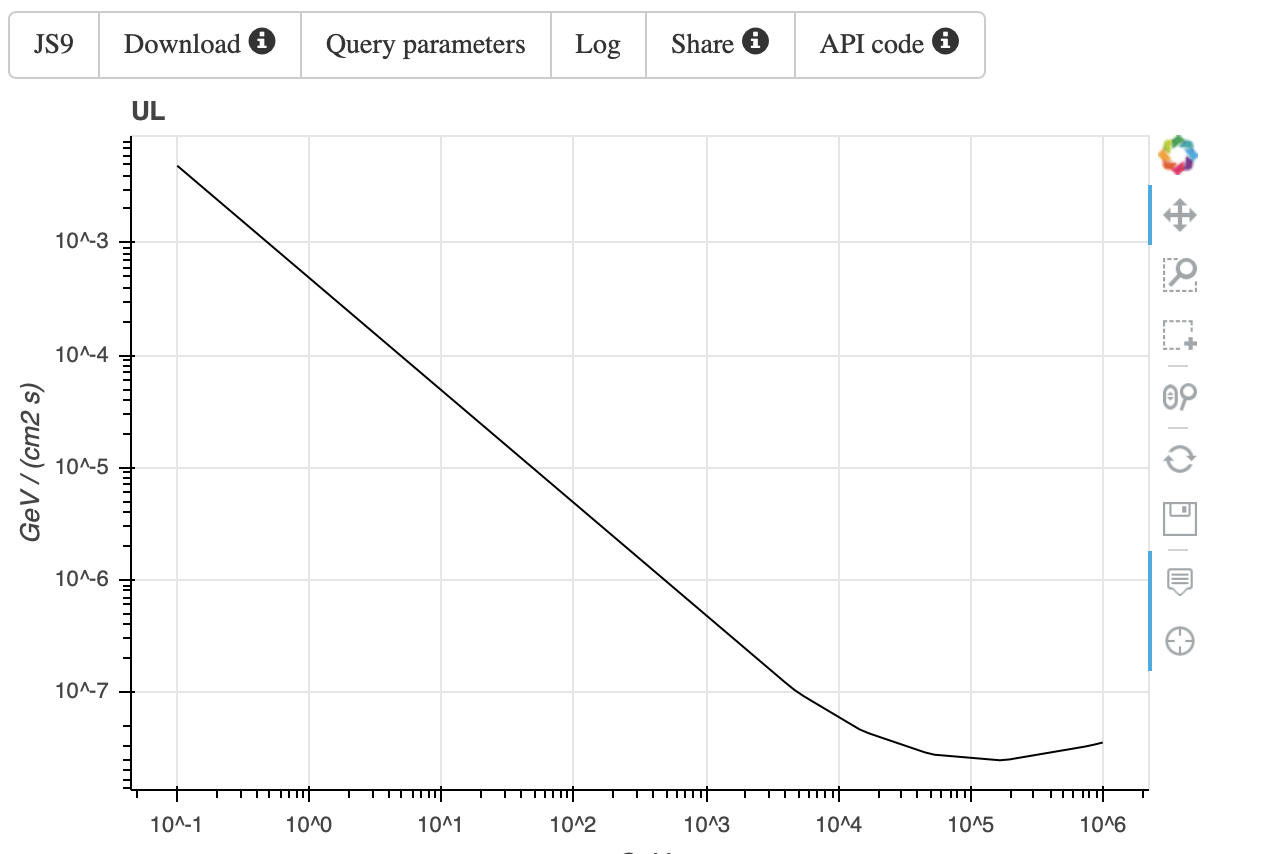
The plot represents an envelope of the upper limits on powerlaw-type spectra, in the sense that any powerlaw spectrum consistent with ANTARES data can at most be tangent to the envelope curve (cannot intersect it). The data plotted in the figure can be downloaded by pressing the "Download" button.
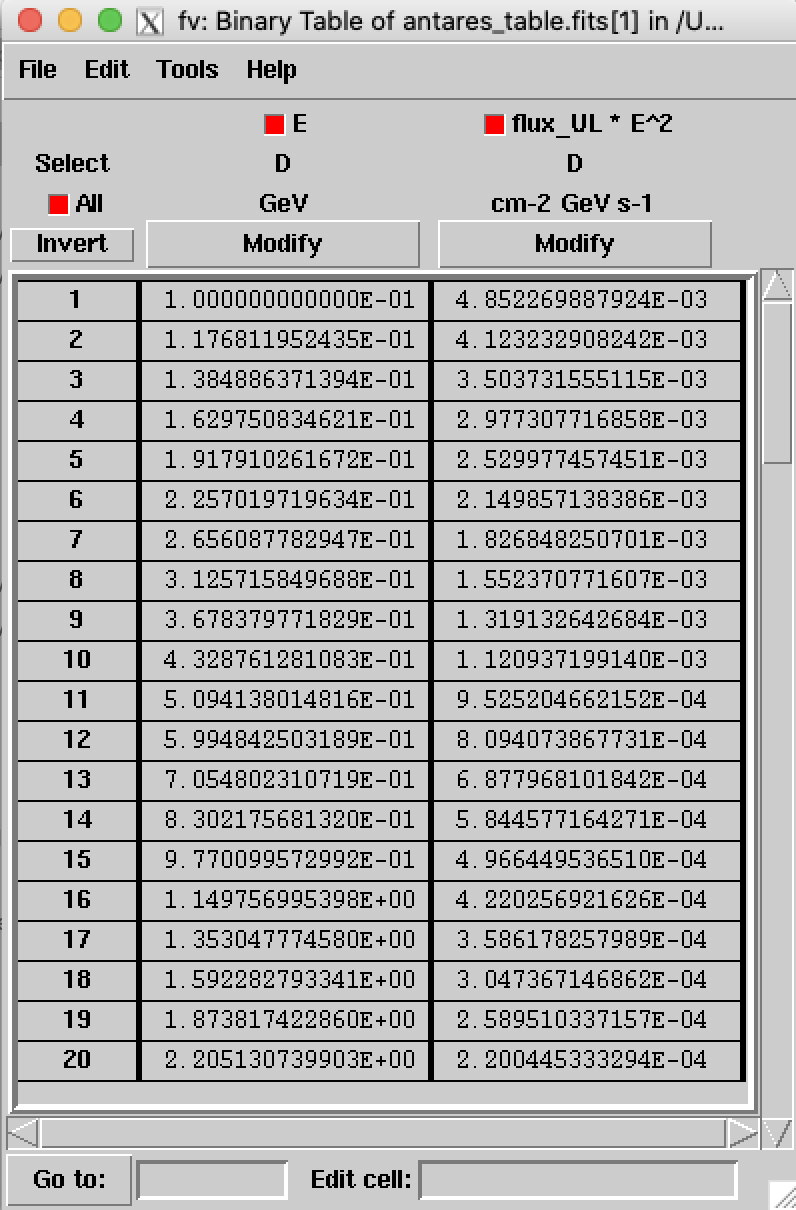
The downloaded file is in FITS format. The first extension of the file is a table with the flux upper limit as a funciton of energy:
It is possible also to load the table directly as an array into Python code. The Application Programmin Integrace (API) code that can be copy-n-pasted into Python code can be obtained pressing the "API code" button. This will copy the piece of code like
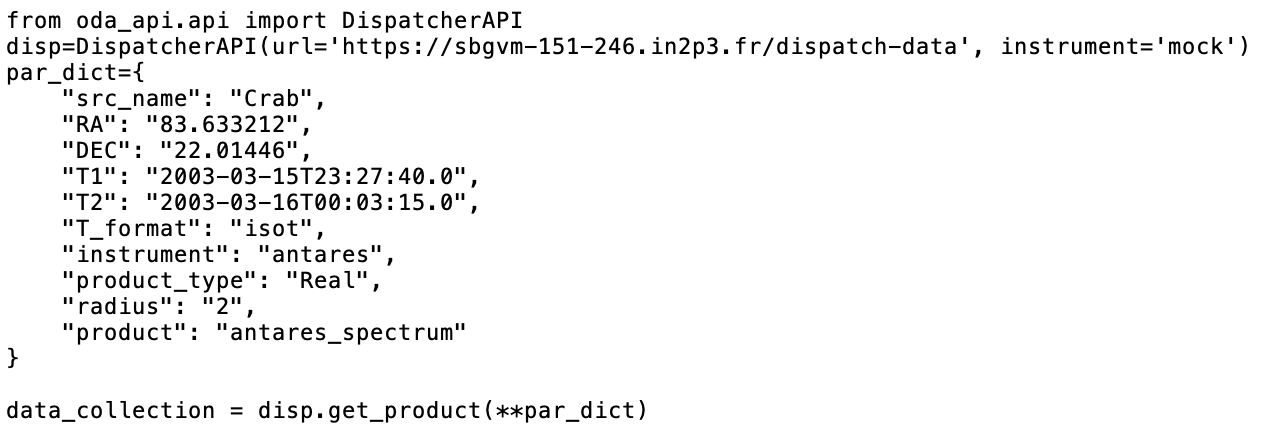
to the clipboard. Otherwise, it is also possible to reproduce the result with the specified analysis parameters through the URL that can be obtained by pressing the "Share" button.