
Stellar continuum#
This tutorial relates to the determination of the stellar continuum from a 1D master disk-integrated or
intrinsic spectrum. Besides its interest for external use, the stellar continuum is required to
run the CCF mask generation module and in some cases the spectral detrending module.
Details about the continuum determination implemented in ANTARESS can be found in Cretignier et al. 2020, A&A, 640, A42.
Activate the calculation of the disk-integrated stellar continuum by setting:
gen_dic['DI_stcont'] = True
gen_dic['calc_DI_stcont'] = True
Replace ‘DI’ by ‘Intr’ if you want to calculate the intrinsic stellar continuum. The continuum will be determined for the 1D master spectrum from each visit, as well as from all visits, of each instrument - provided you calculated the master spectra following the above tutorials.
To ensure that the module captures closely enough the shape of the stellar continuum, without including the wings of broad stellar lines, you can adjust several settings.
A rolling window is first passed over the spectrum to identify any emission peaks that escaped previous corrections. You can control the size of the window (in \(\\A\)) for a given instrument with:
gen_dic['contin_roll_win']={instrument : 2.}
The spectrum is then smoothed to reduce the impact of noisy flux variations, using a Savitzky-Golay filter with width (in \(\\A\)):
gen_dic['contin_smooth_win']={instrument : 0.5}
Local maxima defining the location of stellar lines are identified using a window of width (in \(\\A\)):
gen_dic['contin_locmax_win']={instrument : 0.5}
Next, the spectrum is stretched along the flux dimension by a value larger than 1, so that line maxima are better selected at the ‘top’ of the spectrum:
gen_dic['contin_stretch']={instrument : 10}
Finally, adjust the radius of the ‘pin’ that will be rolled over the spectrum to define the continuum:
gen_dic['contin_pinR']={instrument : 10}
The radius is set at the bluest wavelength of the spectrum and increases linearly with wavelength.
You can visualize the derived stellar continuum in the plot of the master spectrum (Fig. 20), activated using the plot_dic[‘DIbin’] field, and adjust the continuum determination accordingly.
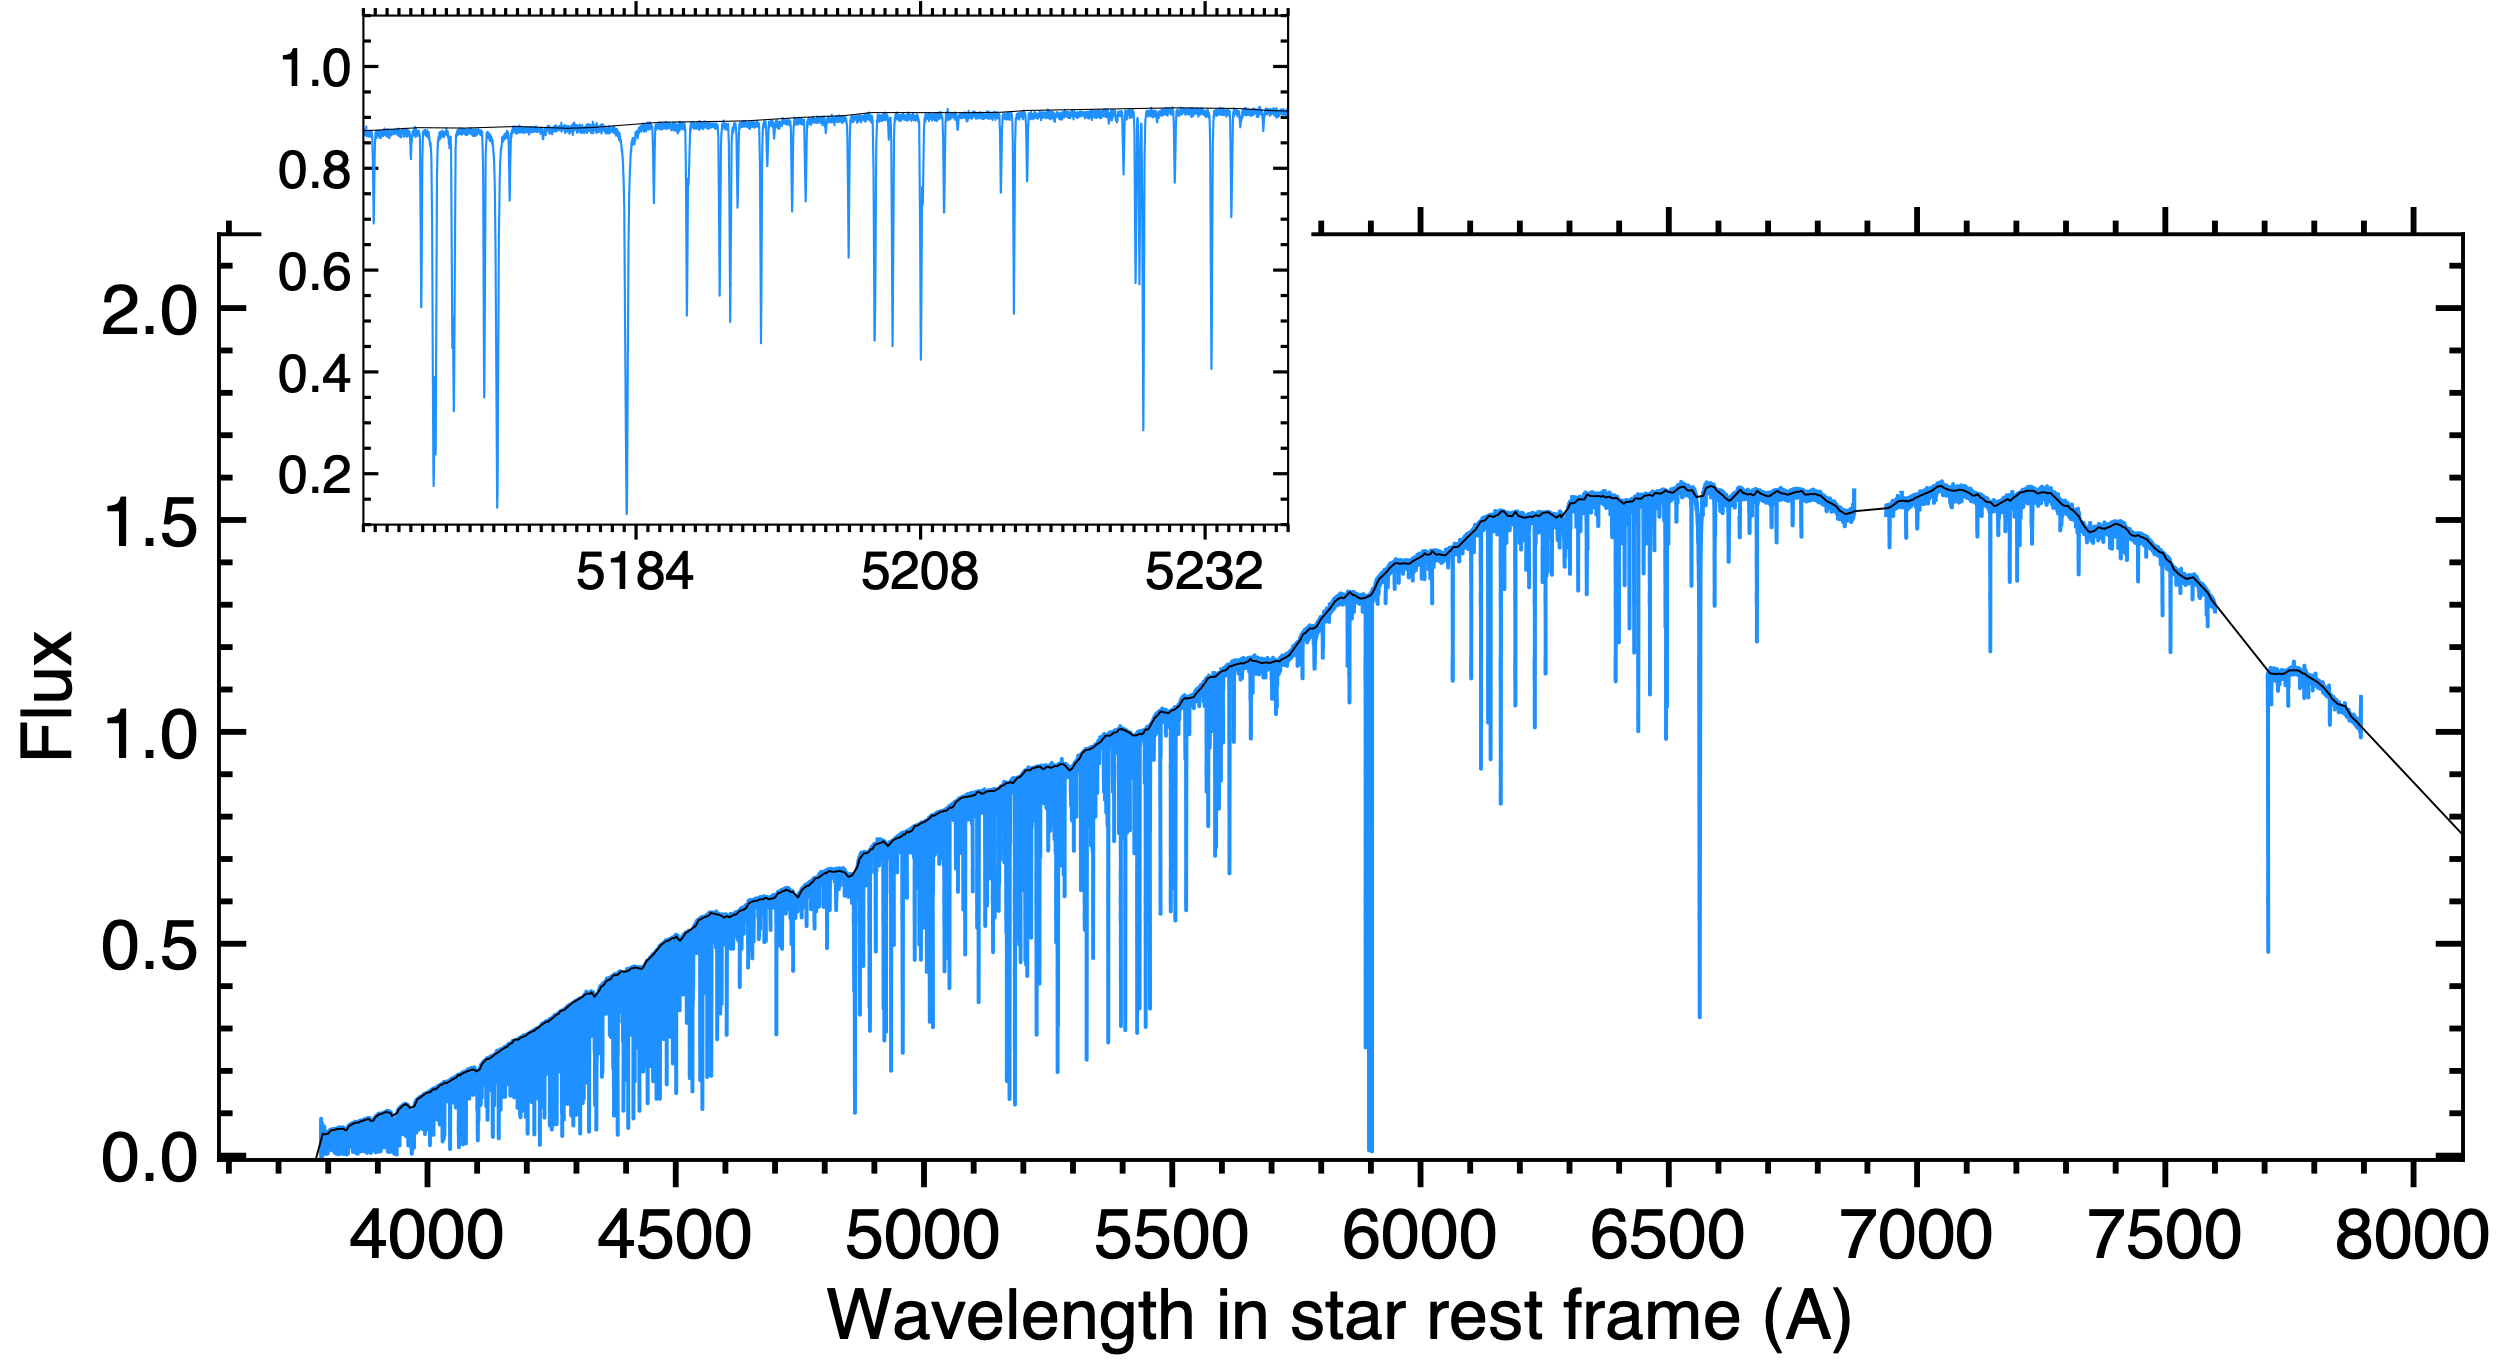
Fig. 20 Continuum (black profile) determined over a 1D disk-integrated master stellar spectrum (blue).#