Fill coordinates from literature
I have seen in ATeL #14588 and #14589 we see that a source is detected at coordinates R.A. = 270.80 deg Dec = -29.80 deg.
We want to check if there are INTEGRAL results from 1 to 5 May 2021, so we insert these coordinate and the start and end time in the source query (the object name is not relevant here).
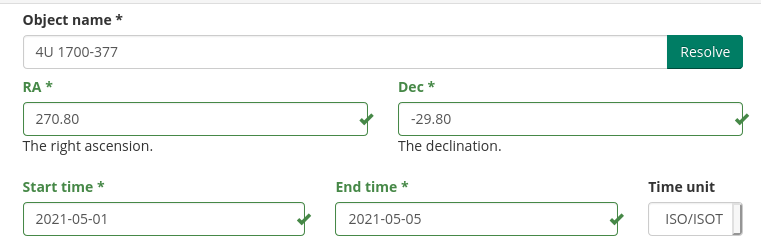
We want to see if the source is detected in IBIS ISGRI, so we click on ISGRI tab and proceed.
ISGRI image request (parameters)

We first coose OSA 11.0, as data are after January 2016.
Then we have a search radius of 10 degrees to exploit the ISGRI field of view with limited artifacts.
We selected science windows from time range
We analyze at most 50 science windows : with login, we can choose up to 500.
Note that some data are private if one year has not passed since their distribution, so we select "All private". This is a serendipitous source, so data rights are not reserved. However, the user must comply with the terms and condition of use and this will be possible only after approval of login ! For public data, login is not necessary, but encourages.
We then select a suitable energy range: here for discovery 28-40 keV is a good practice in our experience. Note that at the beginning of the mission, down to 20 keV could be selected.
Detection threshold can be left to 5 or raised, we discourage anything below 5.
Be sure that "image" is selected and hit "submit button. Soon after you will see a progress windows and will receive an email.
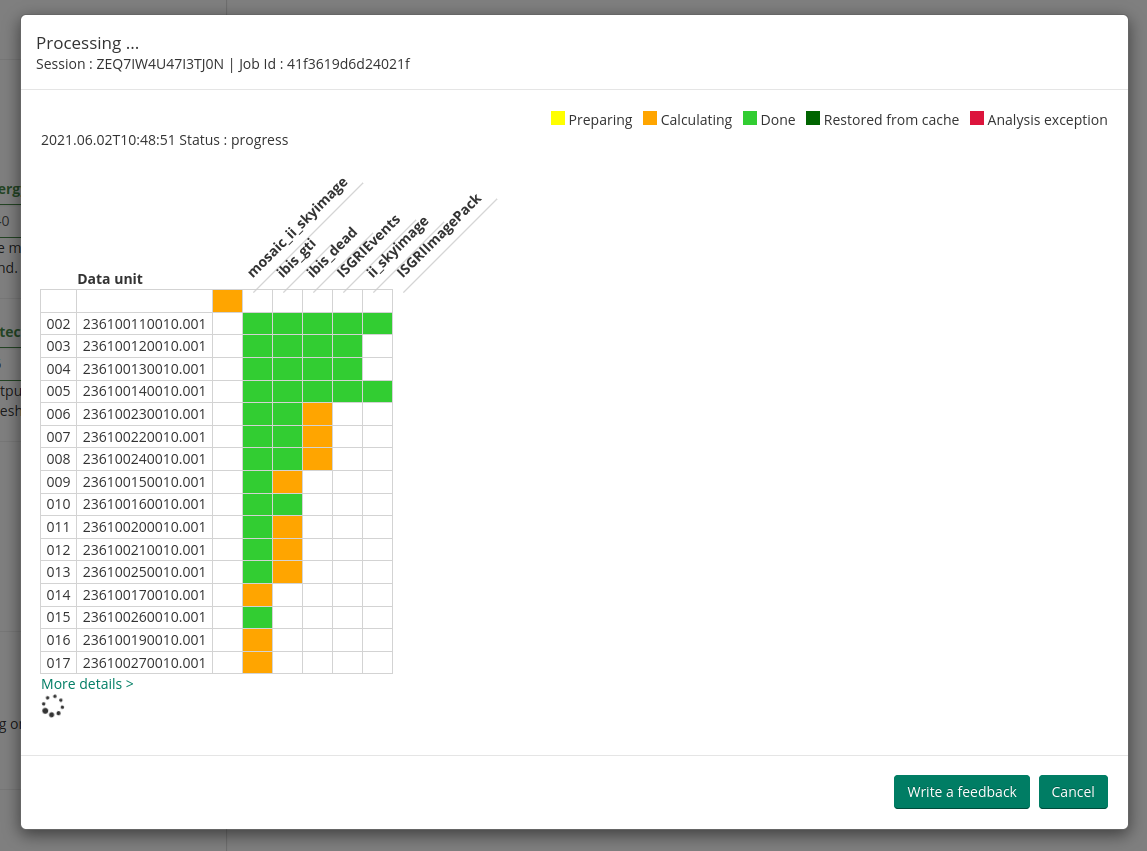

Note that the email is received only with a login ! At this point, you can close the browser window and wait for a second email that will be sent when the product is ready. Three important points in the email:
- the url link allows you to inspect the status of your request at any time or retrieve the data when finished.
- in case of issues you can contact us
- if you are familiar with python, you can get the products also in a jupyter noteboon using the code snippet at the end of the email (not shown here).
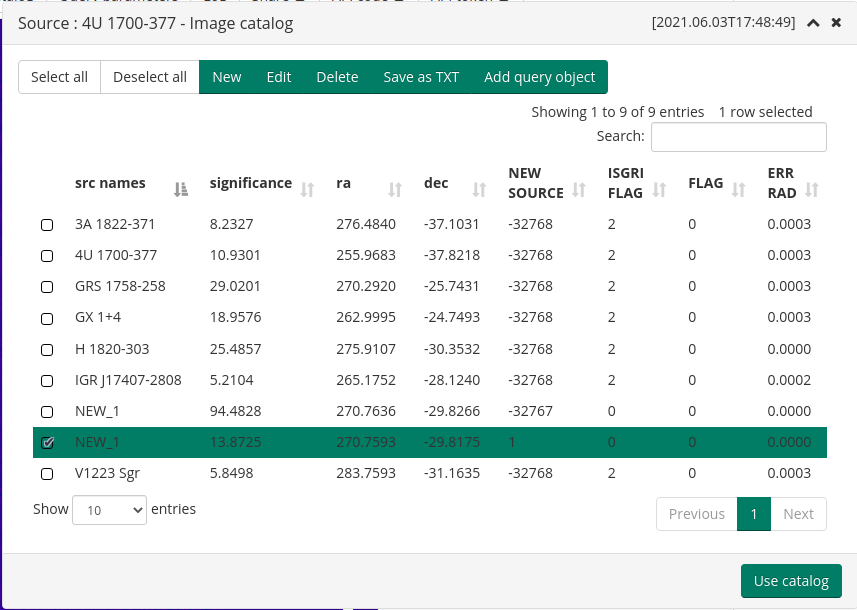
Image and catalog inspection
You will be able to see the image with a new source. You can check its coordinates by looking at the catalog (click on catalog). You will see that there are two new sources in this case. This is because one is detected in the mosaicked image and one possibly in a science window. You can delete one from the catalog by selecting it and clicking on delete. You can click then on "use catalog" to use this new catalog in spectrum extraction or light curve extraction.

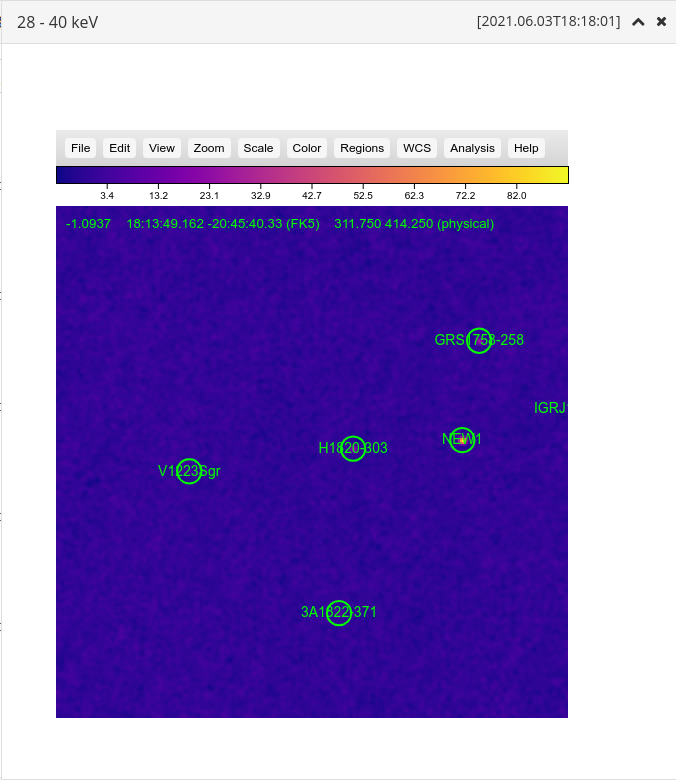
Nothe that if you click on "js9" yoou can see the image with coordinates, but it is not currently possible to visualize regions. To do that, you can save the catalog in a text format and convert it in ds9 region file and load it. Or you can download the image and do it locally.
This command ican be used to convert the catalog.txt text file to a ds9 region file to be loaded by js9 (In this example edit the catalog.txt to change NEW_1 into NEW 1 )
echo "FK5" > region.reg;awk '{print "circle("$5 "d, " $6 "d, 0.5d) {\"text\" : \""$2 $3 "\"}" }' catalog.txt >> region.reg
This thread can be reproduced using this url.
Go to the main MMODA Help