Scope
This interface provides an access for the publicly available data of the DESI Legacy Survey. This includes sky images and photometry data in the infrared-to-visible band. The photometry data is obtained from the queries of TAP service provided by Astro Data Lab(https://datalab.noirlab.edu/ls/ls.php).
Source query panel
The general MMODA interface provides the top panel which allows to specify the sky position of the source of interest.
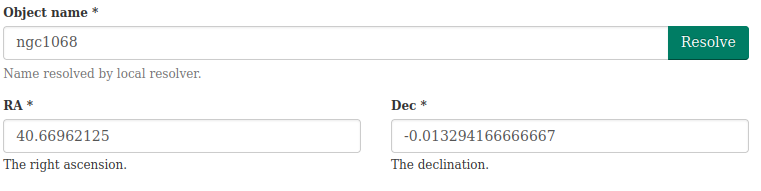
The source coordinates can be either found using the name resolver or directly entered in the RA, DEC parameter windows. The generic parameter panel also includes the time interval parameter windows, however the time information is not used for the Legacy Survey service.
Image
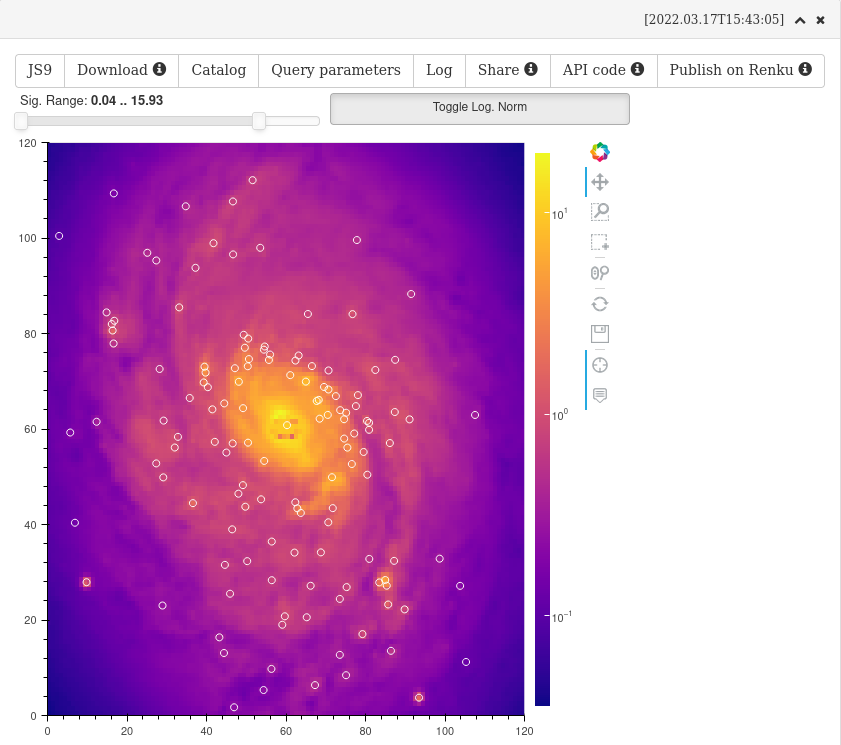
The interface allows to retrieve the sky image and source catalog for the region of interest around the source position. This can be done by selecting the "Image and catalog" radio button in the side instrument-specific parameter panel and specifying the imaging band, the image size, the pixel size and the data release for the catalog:

The image can be retrieved by pressing "Submit" button. The result is the sky image with sources from LegacySurvey catalog overplotted.
The result display window has a number of buttons that allow to manipulate the sky image data products. The "Download" button provides a possibility to get the corresponding image fits file as well as source catalog table. The MMODA interface can be accessed from Python notebooks, using a an API. The API code for the image can be retrieved by pressing the "API code" button. The result will be a piece of a Python code like this:
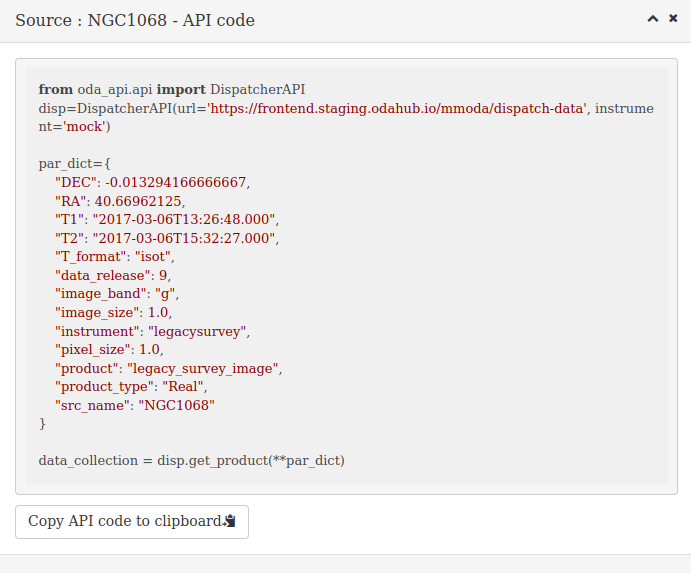
Sky image can also be opened in the JS9 viewer by pressing the "JS9" button.

It is possibly to directly deploy a Jupyter notebook with the API code to retrieve the data product at one of the online notebook servers. The MMODA interface currently provides a possibility to run notebooks on Renku platform provided by Swiss Data Science Centre https://renkulab.io/. This can be done by pressing the "Publish on Renku" button.
The catalog of the sources can be viewed by pressing the "Catalog" button
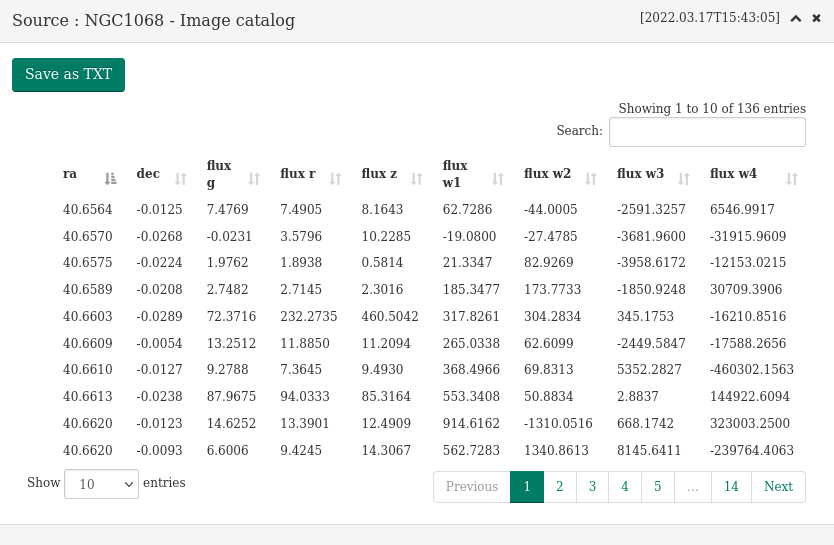
The catalog table lists source positions and fluxes in different bands.
Photometry
Switching the side parameter selector to "Photometry" provides a possibility to extract the infrared-to-visible band spectra energy distribution (SED) for the source or region of interest
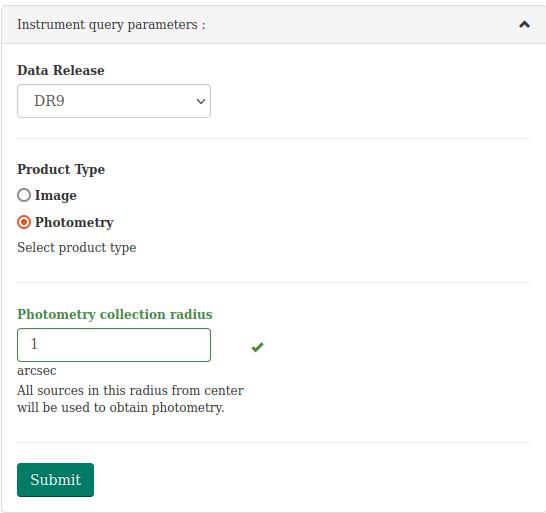
The photometry information that is used for calculation of the SED is extracted from the catalog. To avoid ambiguity of source identification and allow estimate of the flux of extended sources, the "aperture photometry" approach is used: the result shown is the sum of the fluxes of all catalog sources within a circle of the radius that can be specified in the parameter window "Photometry collection radius".
Pressing the "Submit" button initiates the calculation of the aperture photometry SED:

The data points have errorbars, but they are rather small and may be not visible for bright sources.
Similarly to the image and catalog, the SED data display has several buttons that provide a possibility to manipulate the result. The "Download" button allows to get the table representation of the photometry data. The results window also buttons to get an API code to access data products from Python and the "Publish on Renku" button to open this code in the interactive session of Renku platform.